FLIM: Fluorescence lifetime imaging microscopy
The fluorescence lifetime of a fluorophore is a measure of the average time a fluorophore remains in the excited state S1 after excitation, as shown in the Jablonski diagram below and the lifetime can be described by an exponential decay. The fluorescence lifetime is different for every fluorophore, and the fluorescence lifetime of a fluorophore can change due to external factors changing the conformation of the protein and thus how long it stays in S1, giving rise to functional information about the interaction of the fluorophore with other proteins and ions in the environment.
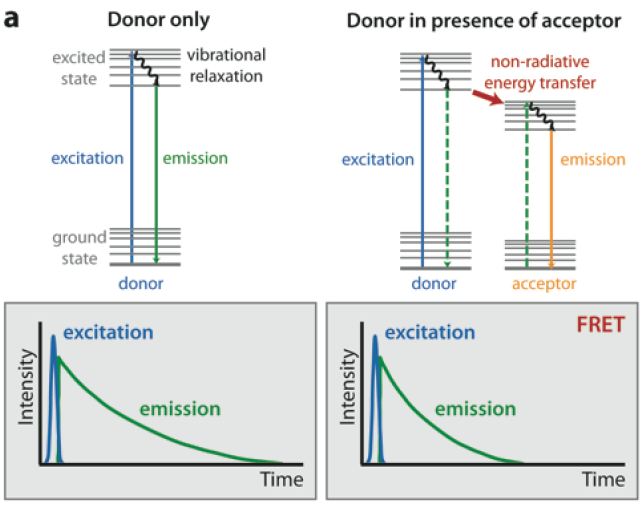
From Simkova et al 2012
Fluorescence lifetime is independent of dye concentration, photobleaching, light scattering and excitation light intensity.
Fluorescence lifetime is dependent on environmental conditions such as ions, pH, oxygen content, interactions with other proteins. Therefore, fluorescence lifetime imaging allows us to perform accurate ion concentration measurement and Fluorescence Resonance Energy Transfer (FRET) analysis
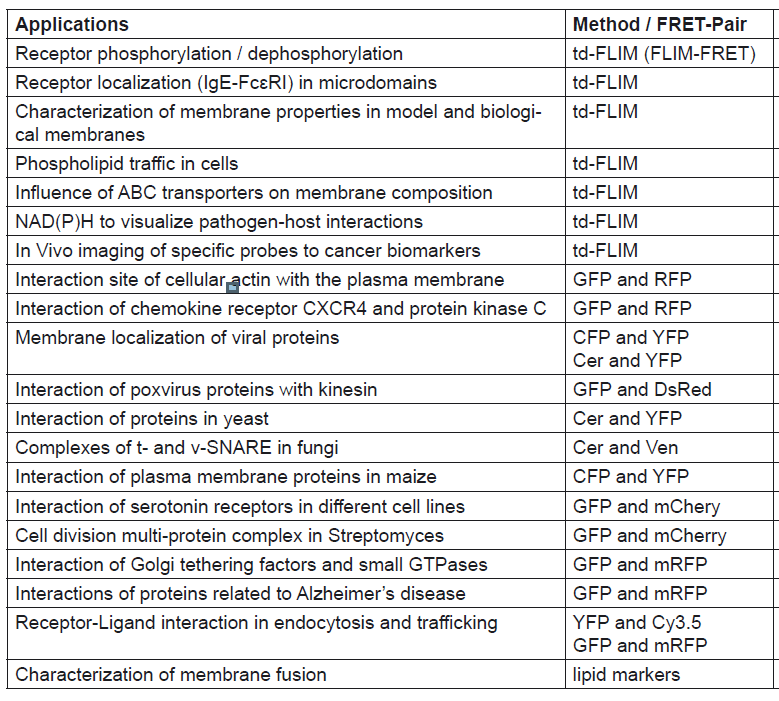
Sometimes it is useful to see applications of FLIM, to help you figure out if this is something you can apply to your research, but this is not an exhaustive list.
IMB FLIM presentation
FLIM software is available on the VMs at IMB and free to download.
It is useful to watch the videos on how to use the software
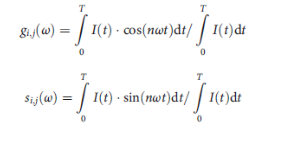
The fluorescence lifetime / behaviour / signature can also be analyzed in a phasor diagram.
The emitted fluorescence can be described by in the frequency domain by:
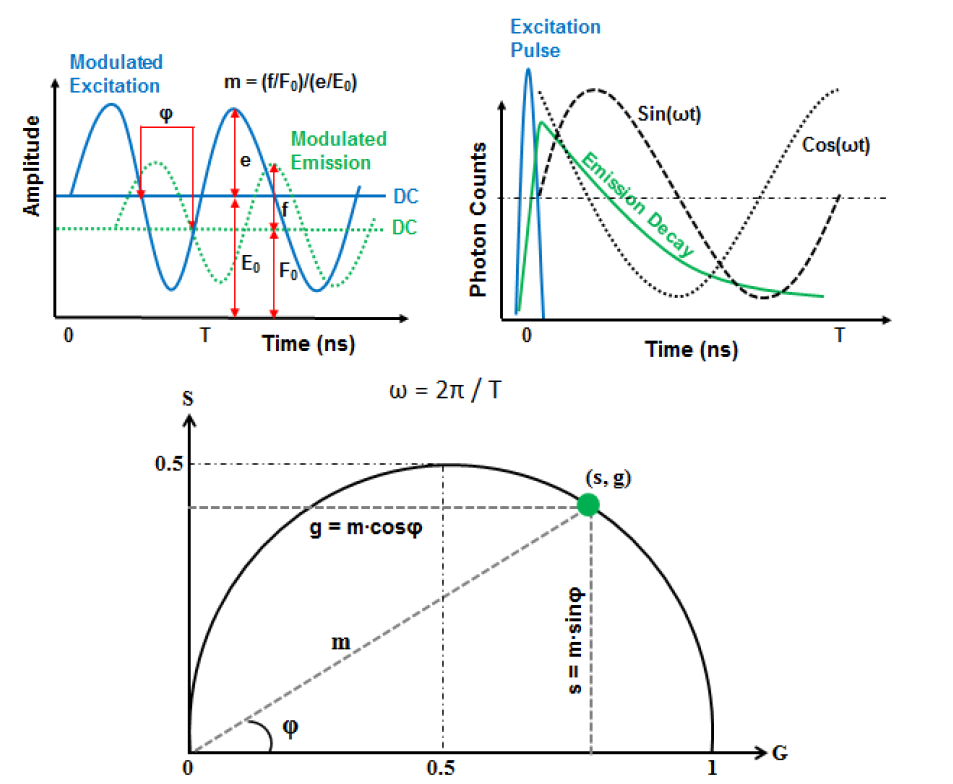
From ISS Phasor plot
Microscopy: Fluorescence Lifetime Imaging Microscopy (FLIM) (Philippe Bastiaens)
The Leica SP8 is able to collect time correlated single photon counting data which enables FLIM acquisition through the FALCON module, and provides fluorescence lifetime values as well as a phasor plot representation of the data.
Many review papers have tables of expected mean lifetime values, but some standard fluorophores can be found here.
Some old FLIM resources.